| Inevitably,
there would be variation: if different people, different teams, different
factories were all aiming to replicate the same thing, individual
influences would all creep in. Variation is to be expected, so the idea of
'quality control' was to maintain variation of product within acceptable
limits. This took the form
of dedicated QC personnel who acted as inspectors, checking on finished
product, and filtering out any outside tolerance. |
| Some paradigms
developed around this: |
| - makers make
...their job is producing, and quantity is the prime goal |
| - QC people
check. If they can't find any problems their existence may be questioned |
| - the later in the process
the inspection, the lesser the risk of defects being found by customers |
 |
| - there is a trade off: the
better the quality, the more time and effort (therefore cost) is required
to achieve it |
| - you can't have everything -
there has to be a choice! |
|
In 1925 a new
approach was pioneered in the Bell telephone Laboratories, USA, and the
term 'Quality Assurance' was coined. It introduced SQC (Statistical
Quality Control) and started to recognise many of those humanistic and
organisational features subsequently associated with TQC. The Depression stifled these initiatives,
and they were
not seriously re-visited until driven by wartime needs.
|
|
|
| In the post-war
period quality control was eagerly adopted in Japan. The prime focus
remained on the shop floor, but a less polarised approach developed:
quality was held to be everyone's responsibility, rather than the preserve
of the 'quality controllers'. A team approach to solving problems was
developed which became known as 'Quality Circles' - people getting their
heads together to solve quality problems. |
| A different way of
thinking started to form on the shop floor: not only was it important to
satisfy the consumer, but to satisfy each person's downstream customer.
Give the customer what he wants and he can concentrate on doing his job
properly. Apply this all the way down the supply chain and the ultimate
consumer will be well-served. |
| Also, the notion
that 'quality' is
not simply the total of all the attributes on the finished product
(achieved by hook or by crook!) but the consistency with which
these are achieved. Reliability, dependability, predictability, etc. of
people, processes, and plant were recognised as being as important the
product itself. 'Right First Time' became a goal. |
| Thus the remit of
Quality Circles was expanded to cover anything that had an influence on
the process or product. The only constraint was that teams should only
address items within their sphere of control. Methodologies and a structured
approach were developed and promoted on a national basis by JUSE (Japan
Union of Scientists and Engineers) following initial guidance from
American mentors, notably Deming and Juran.
|
|
|
| Teams need a game
plan, so the four-phase cycle was adopted as the broad TQC methodology. In the thirties, this was
developed as the Shewart wheel (illustrated), after an American physicist/
statistician; when
promoted by Deming in the late 1940s / early 1950s it assumed his name;
and is |
|
|
now commonly known in the west as the PDCA cycle, and in Japan as
the kanri (management) cycle. |
| The content of the various
phases is varied to suit the particular application - the kanri cycle
takes the form: |
| 1)
Planning: Establish plans for accomplishing the purpose of business. |
| 2)
Doing: execute plans according to programs. |
| 3)
Checking: check whether or not the results satisfy the initial purpose. |
| 4)
Action: correct or eliminate the problems found in the checking stage. |
|
|
Similarly, QC
circles label the stages according to their particular problem solving approach
- for example:
PLAN:
state problem, set target, identify activity
framework
DO:
gather data, analyse, consider
countermeasures, plan trials
CHECK:
assess effectiveness of countermeasures
ACTION:
apply new standard; consider further improvement |
| Note the term
'countermeasure' rather than 'solution'. In continuous improvement we
accept that 'there is always a better way', hence the cycle, rather than a
finite, linear approach. |
|
Although 'The Seven
Statistical Tools' or 'The Seven QC Tools' are frequently referred to, the
identity of the seven often varies! 'New Tools' were developed in the
1970s, primarily for the use of management/engineers or in
specialist areas: |
|
-
Multivariate analysis, and statistical analysis of reliability |
|
- Quality table or
quality deployment, FMEA (Failure Mode and Effects Analysis), and FTA
(Fault Tree Analysis) |
|
- 7 Management Tools for QC: Affinity diagram, relation diagram, tree
diagram, matrix diagram, arrow diagram, PDPC (Process Decision Program
Chart) and matrix-data analysis.
|
| TQC Development |
| Quality circles had
beneficial effects not only on product quality, but also on the way people
worked together and the way they managed their work environment and
processes. The same approach spread from the shop floor into other areas
of business - Support departments, Administration, Design, ... in fact
everybody in every function that has a customer to satisfy! The 'Total'
was added to 'Quality Control' to signify the company-wide approach.
(sometimes 'CWQC') |
Given a basic grounding in QC
practices to assure product quality, develop the people and strengthen the
business, other areas of specialisation emerged - TPM (Total Productive Maintenance)
to assure facility integrity, hence delivery; JIT on the optimisation of material
flow to produce at minimum cost.
With quality and delivery taken as 'givens', efforts focus on draining
waste, wherever it may be found in the system, to reduce cost. |
|
| Western adoption of
this approach suffered some compromises: 'Quality Control' had bad
connotations - so became called 'Quality Assurance'; "We'll tell people
they're responsible for their own quality, but not develop their
understanding ...and we'll only focus on the shop floor!" QC Circles were
introduced piecemeal, often with emphasis on results alone, without
understanding the processes through which results are achieved.
Manufacturing at minimum cost has been sought without undertaking the
intermediate steps. |
| Where TQC has been
effective, it has often been under the 'Total Quality Management' banner
(avoiding the 'control' word!). Such companies have been prepared to
invest time and money in developing their people, and the organisational
framework within which they work, in order to establish paradigms for the
21st Century - then tackling the practical aspects. |
| In Japan, no
conflict is seen between the various philosophies, tools, techniques,
systems, etc.: they are integrated into the way the company, as a whole,
conducts its business. Having applied TQC, TPM, JIT and all, and tuned
them to their own requirements, they are often labelled 'The XXX Production
System'. Genba Kanri is the generic term for this.
|
| It is self-evident
that in any distribution 50% of the population will be more than average;
50% will be lower. The standard deviation tells us more:
it is known that 68.26% of the population (from which the sample is
derived) lies within +/-1s
of the mean; 95.44% within +/-2s;
99.73% within +/- 3s.
|
 |
| Traditionally, this last figure
has been known as 'six sigma', or '6s', the benchmark of acceptability for a process
(individual machines +/-4s:
99.994%) when
assessing capability. It accepts that one part in 400 |
| will be outside
tolerance. Even +/-4s accepts that 6,000 parts per million will be outside tolerance, and will have to be
'inspected out' before reaching the customer - or the costs of customer
dissatisfaction paid! Much filtering can be achieved through human or
mechanical means - but this still costs money. |
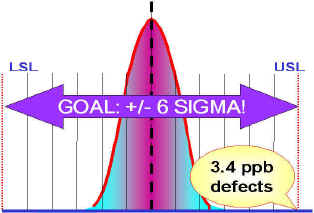
| Nowadays, in World
Class companies, no more than 20 ppm defects are acceptable, and the
objective of zero defects is being aimed at through achieving process
capabilities
of +/-6s. No part of
the process is being ignored: Design, Procurement, Manufacturing,
Logistics, Service ...every aspect of the business joins in the effort.
Whilst consistent with the ideals of JIT, TPM, TQC and all, in achieving
high quality and rapid delivery at minimum cost, the
banner of Six Sigma has been adopted for the approach by some, most
notably Motorola and General Electric in the USA.
|
| Six Sigma can be as effective as
any other rigorously-applied improvement theme. Experience shows that the
three main factors to ensure success are:
1) Top management
support
2) Process management
support
3) Selection of projects where the cost of poor quality has hitherto been
invisible
Although most companies applying it
would not claim six sigma capability, it provides a very clear objective. |
 |